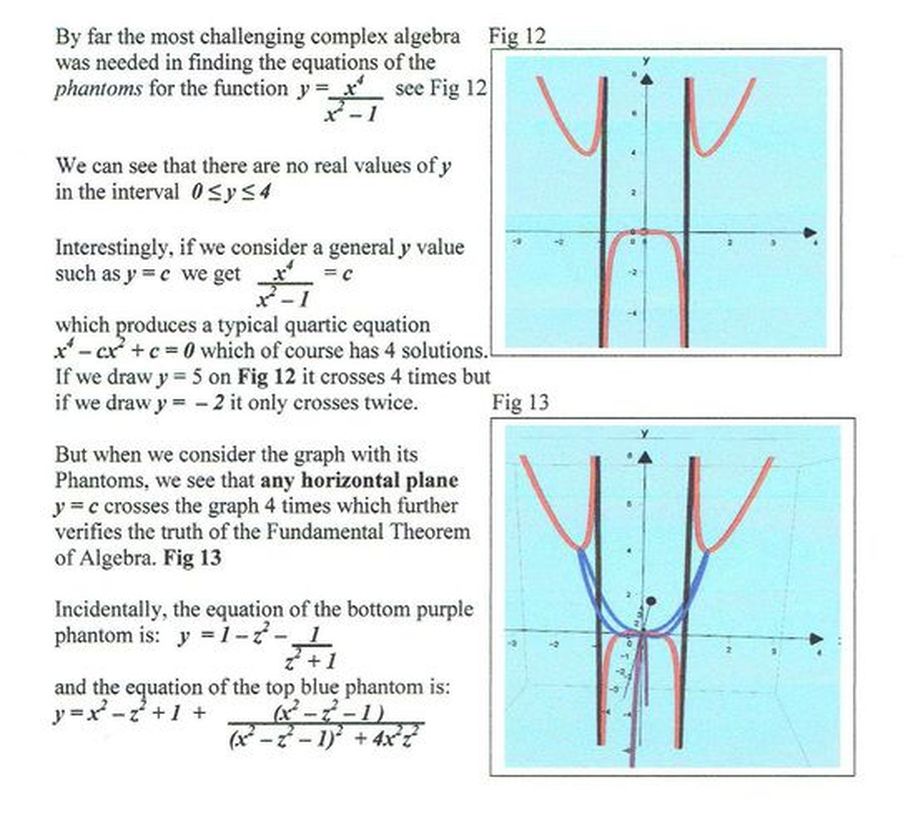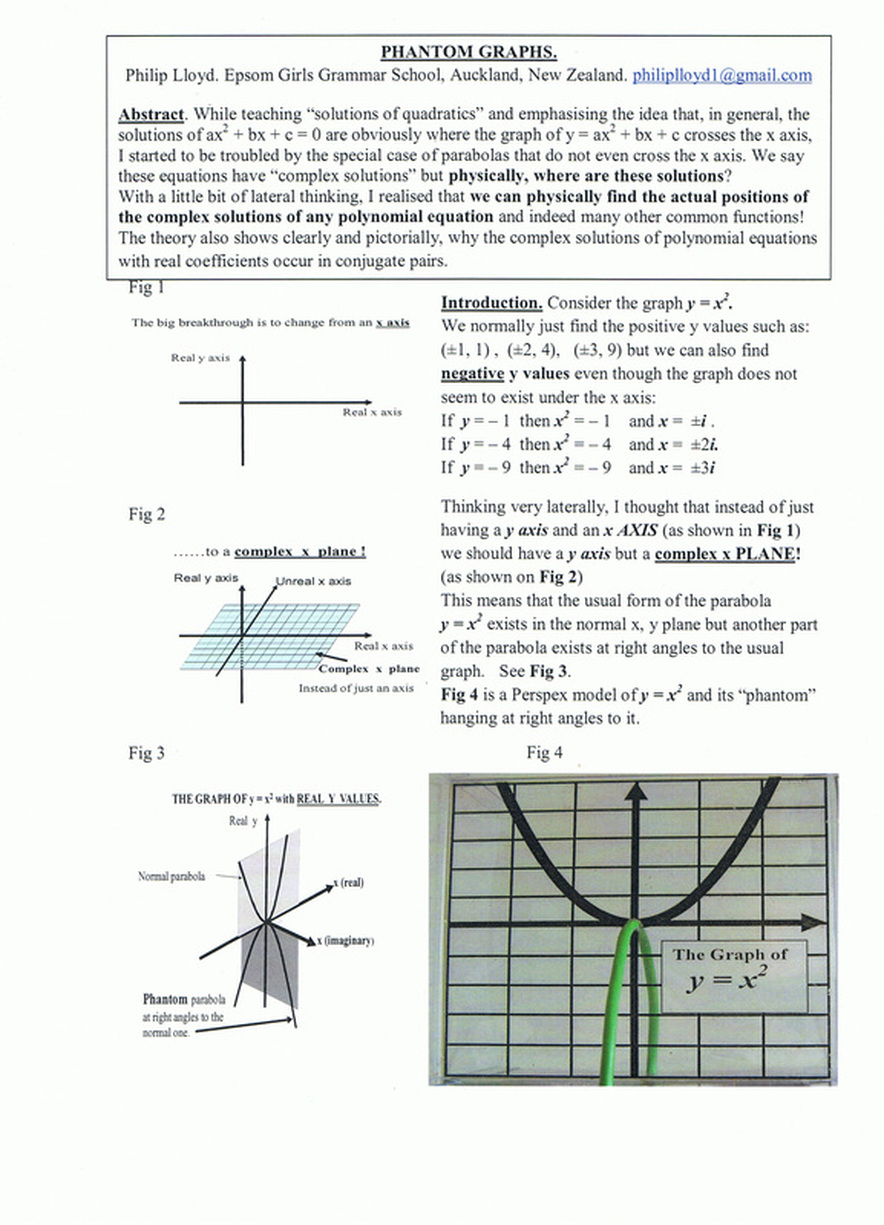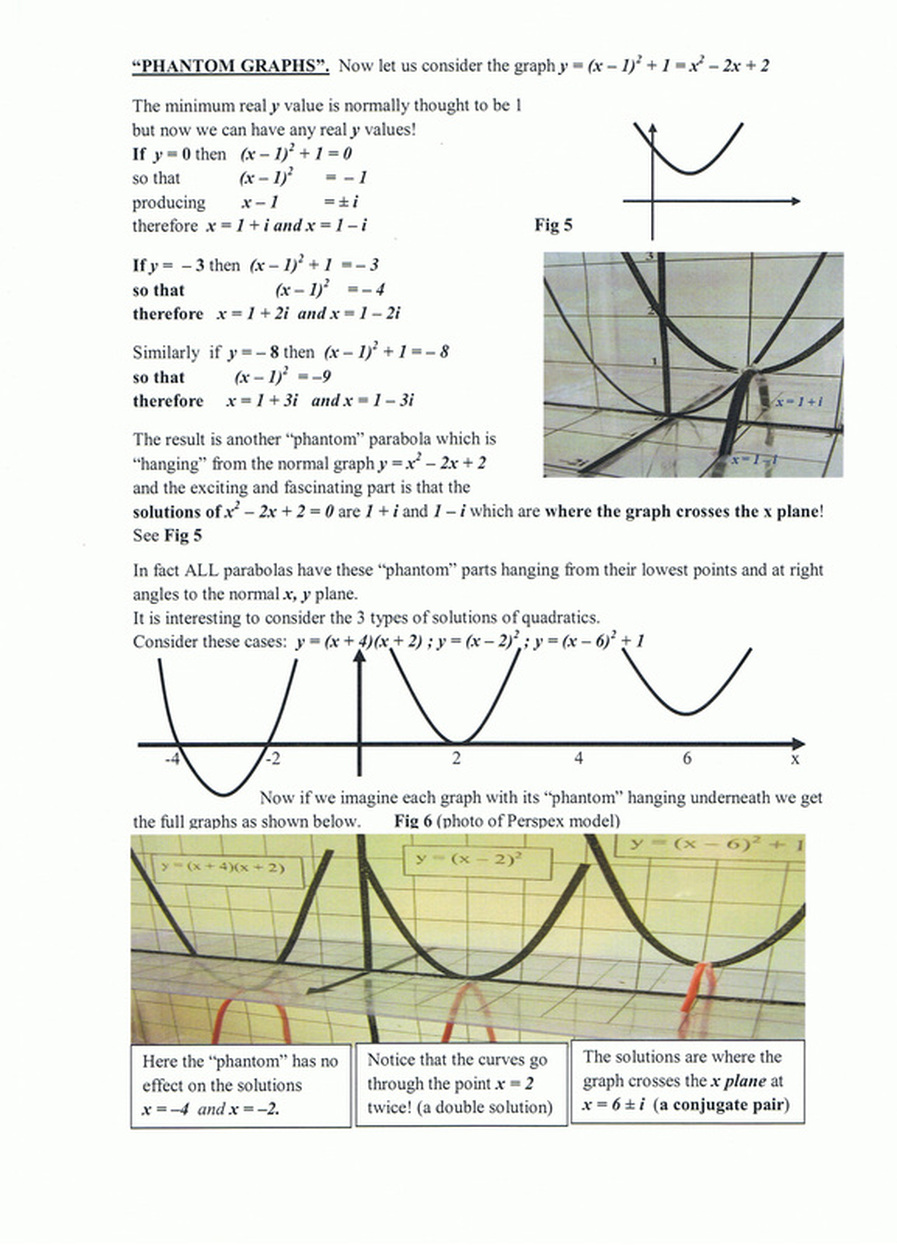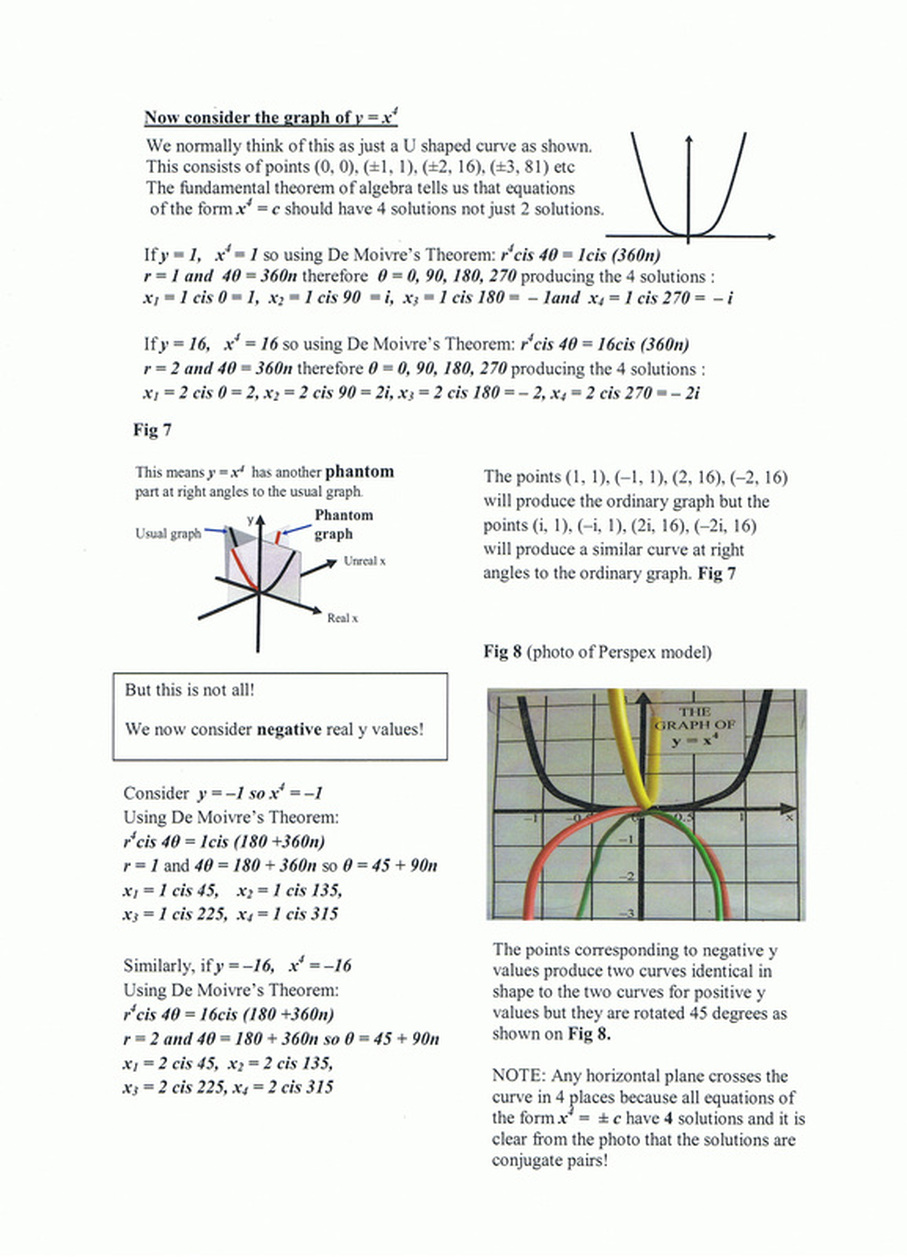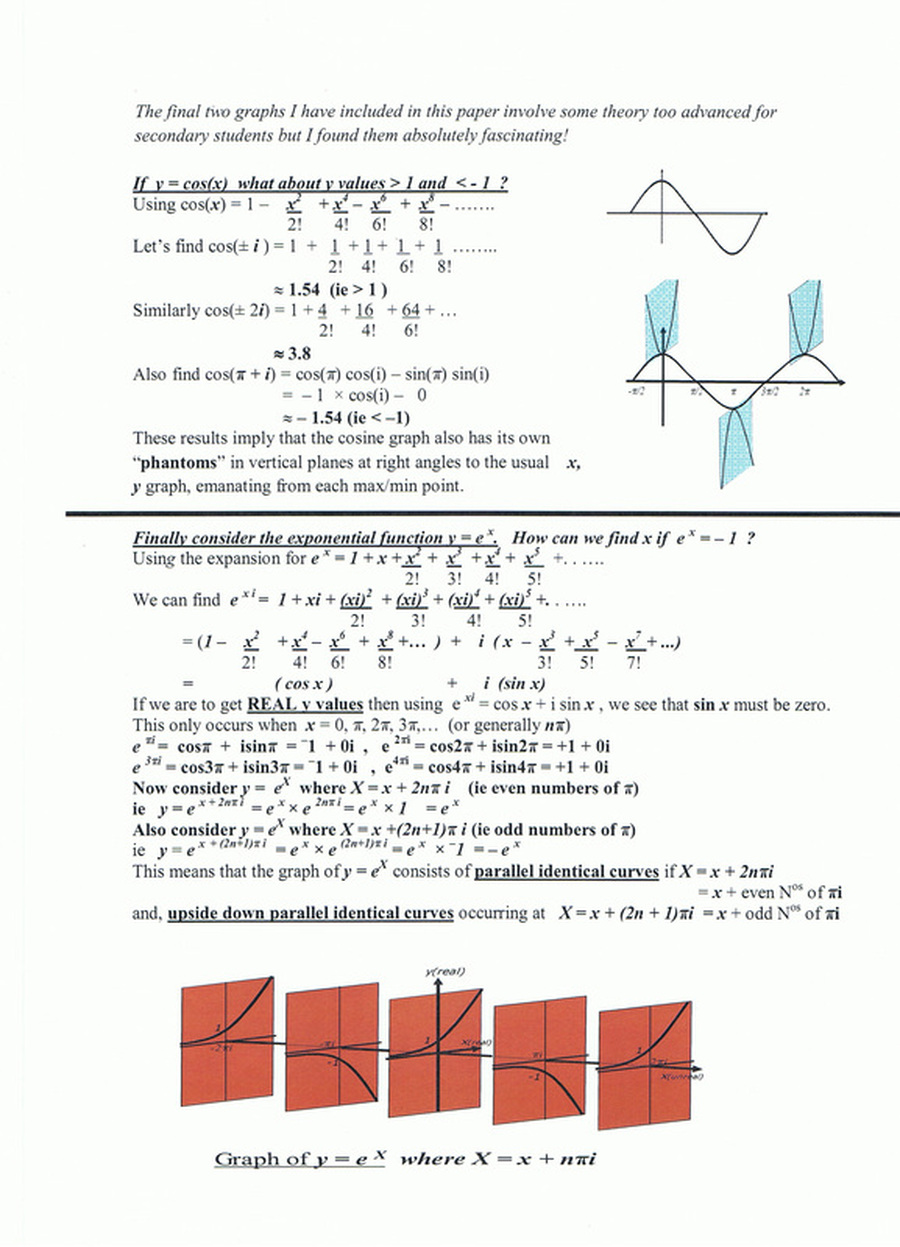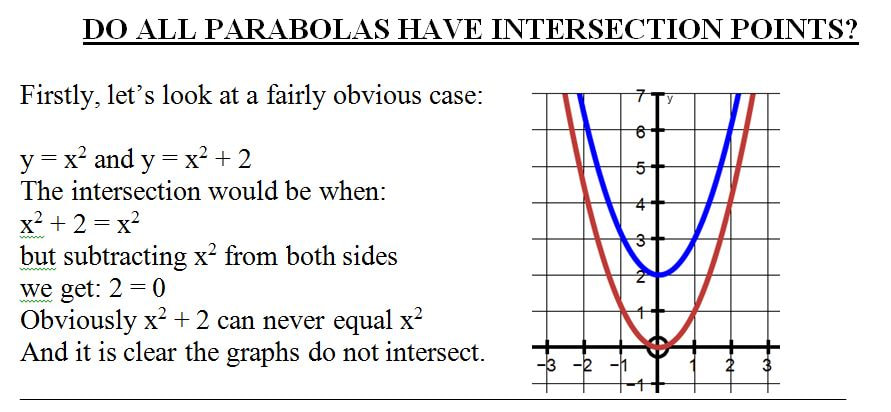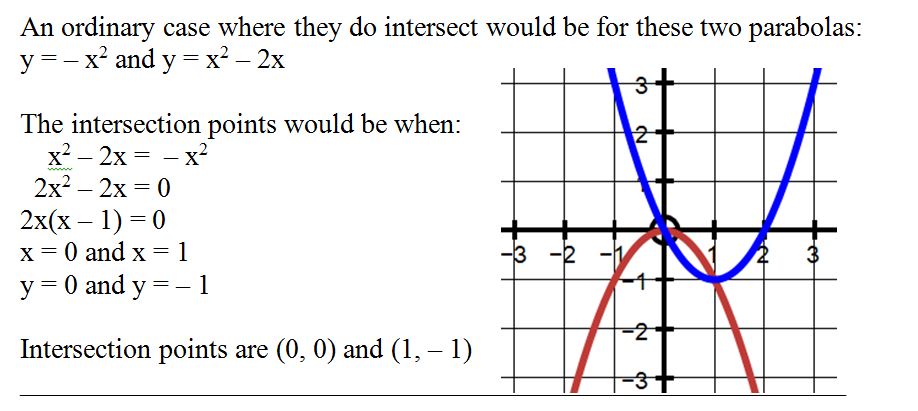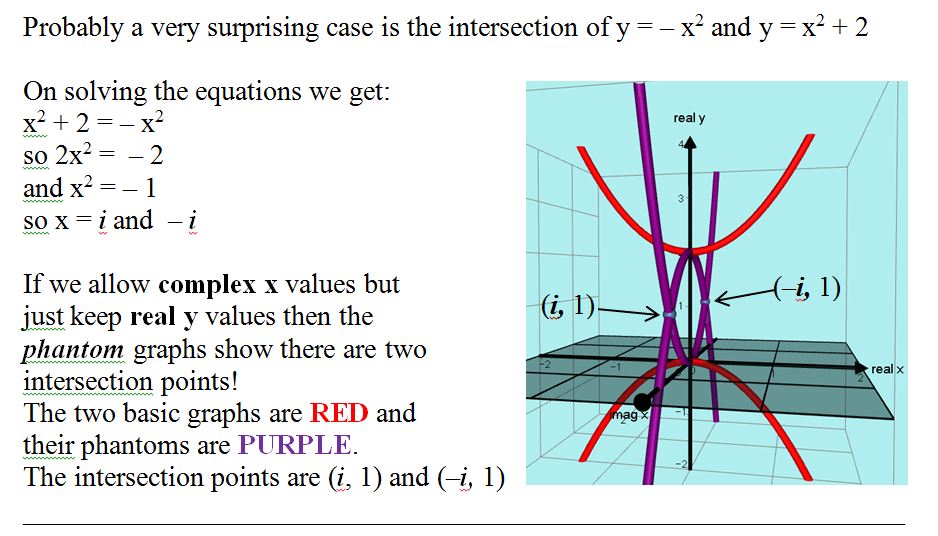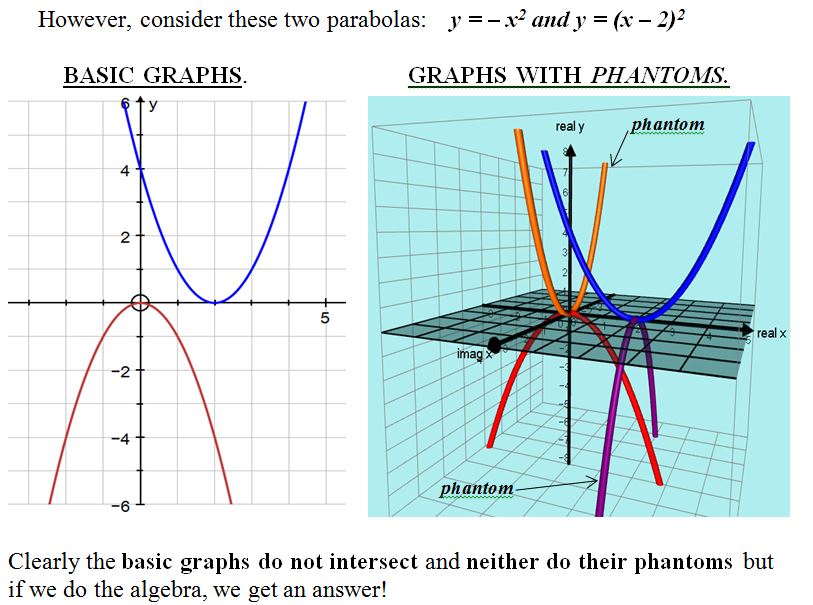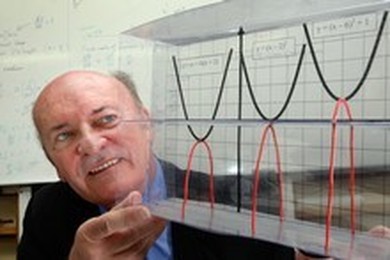
Mathematics teacher Philip Lloyd with a model of his “Phantom Parabolas” showing the real position of imaginary solutions of equations.
Very few people wake excitedly every Sunday at 3am thinking about calculus!
But that is what happened to Epsom Girls Grammar teacher Philip Lloyd, who has come up with a new way of showing the real positions of imaginary solutions of equations.
The teacher of 47 years is now receiving international praise for his concept.
"It came to me at 3am on a Sunday morning," Mr Lloyd said.
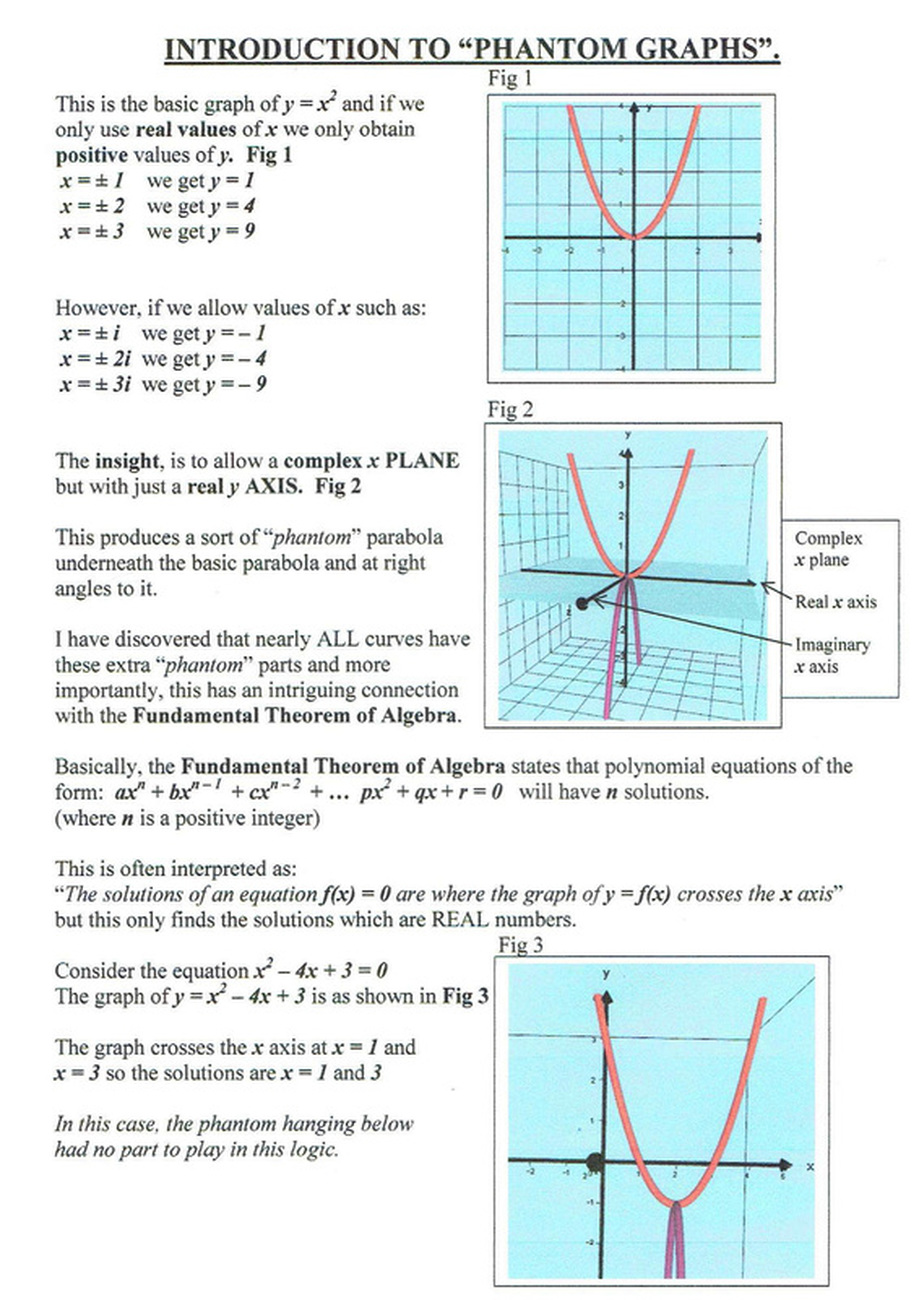
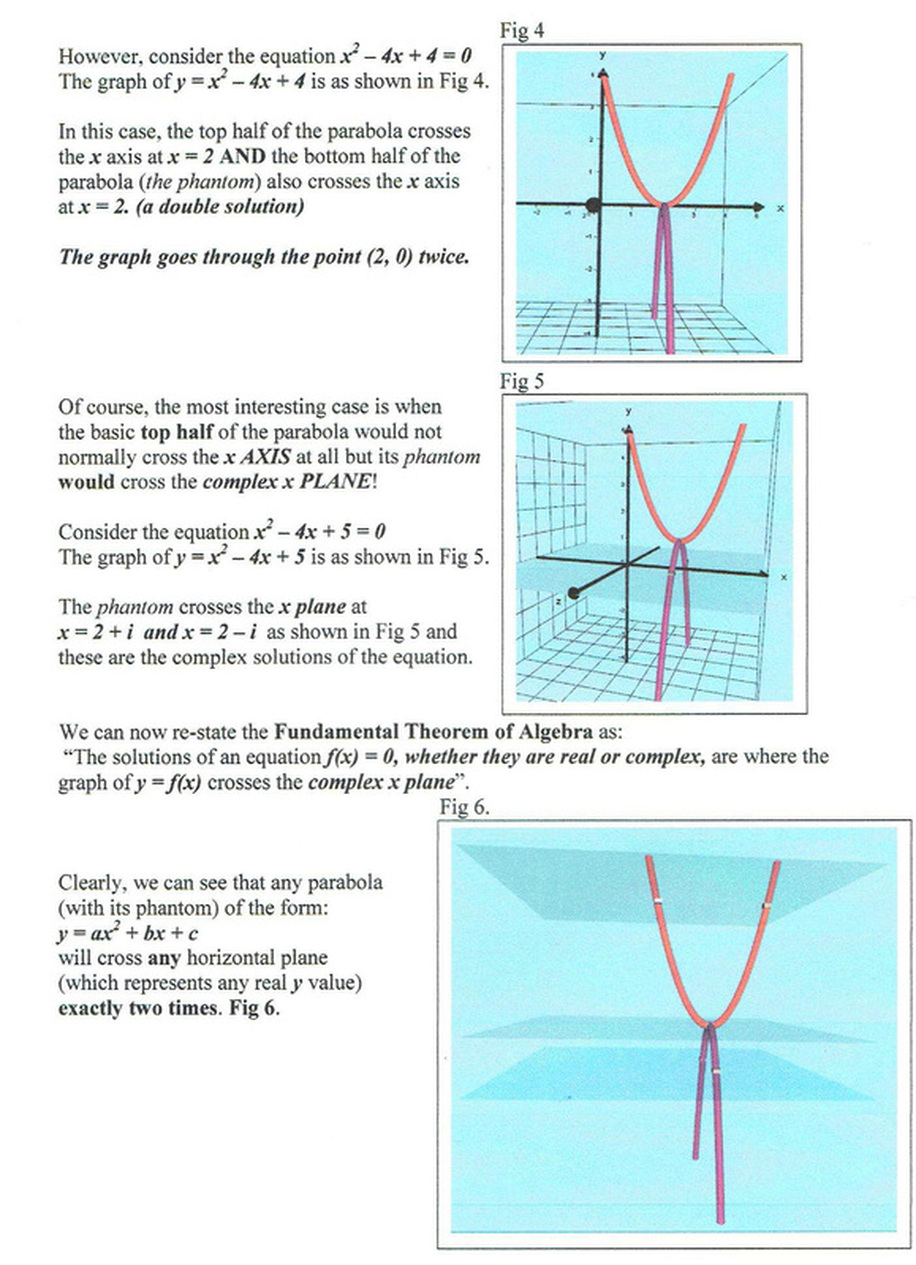
"In simple terms, the solutions of an equation are where its graph crosses the x axis. Some graphs do not cross the x axis but we still say they have solutions which people call ‘imaginary’."
It was this "imaginary" concept which many students struggle to accept. Because they can't see it, many tended to find it difficult to believe.
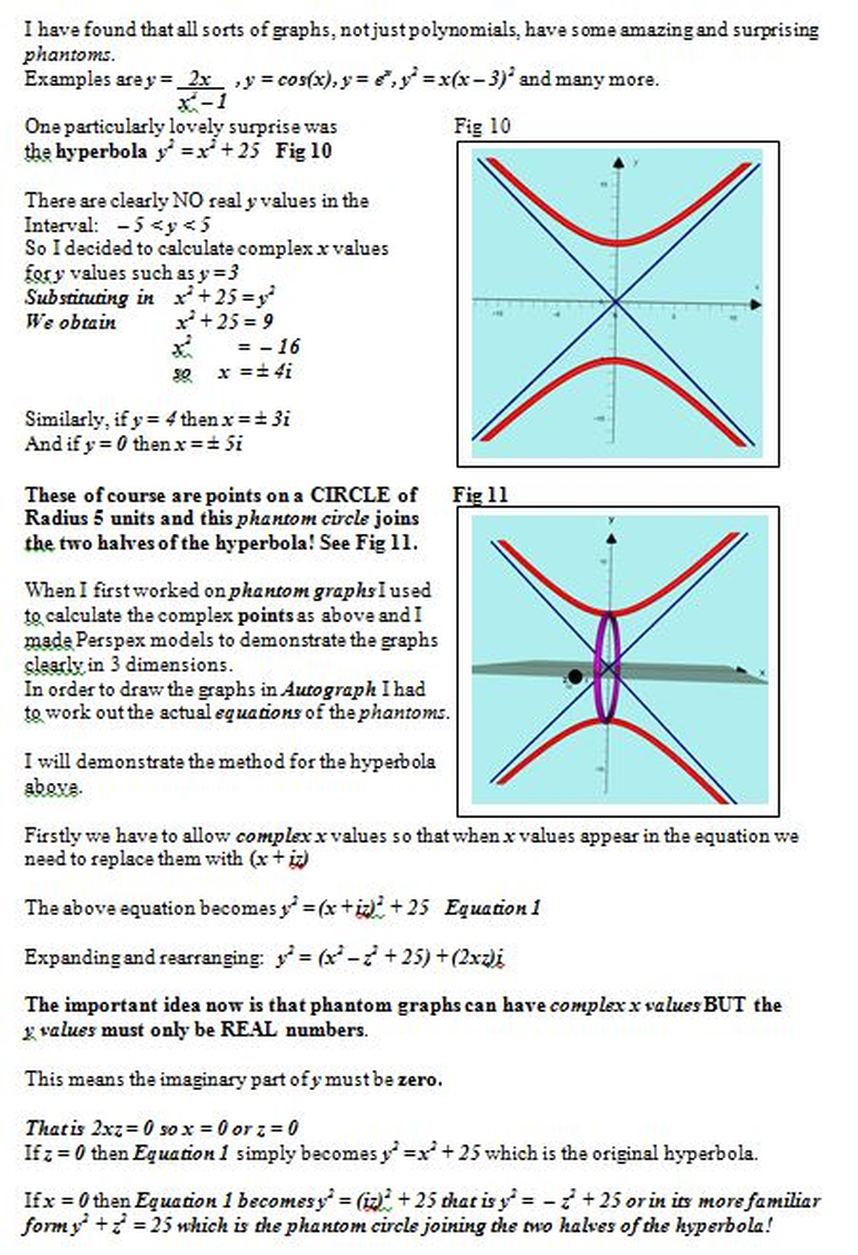
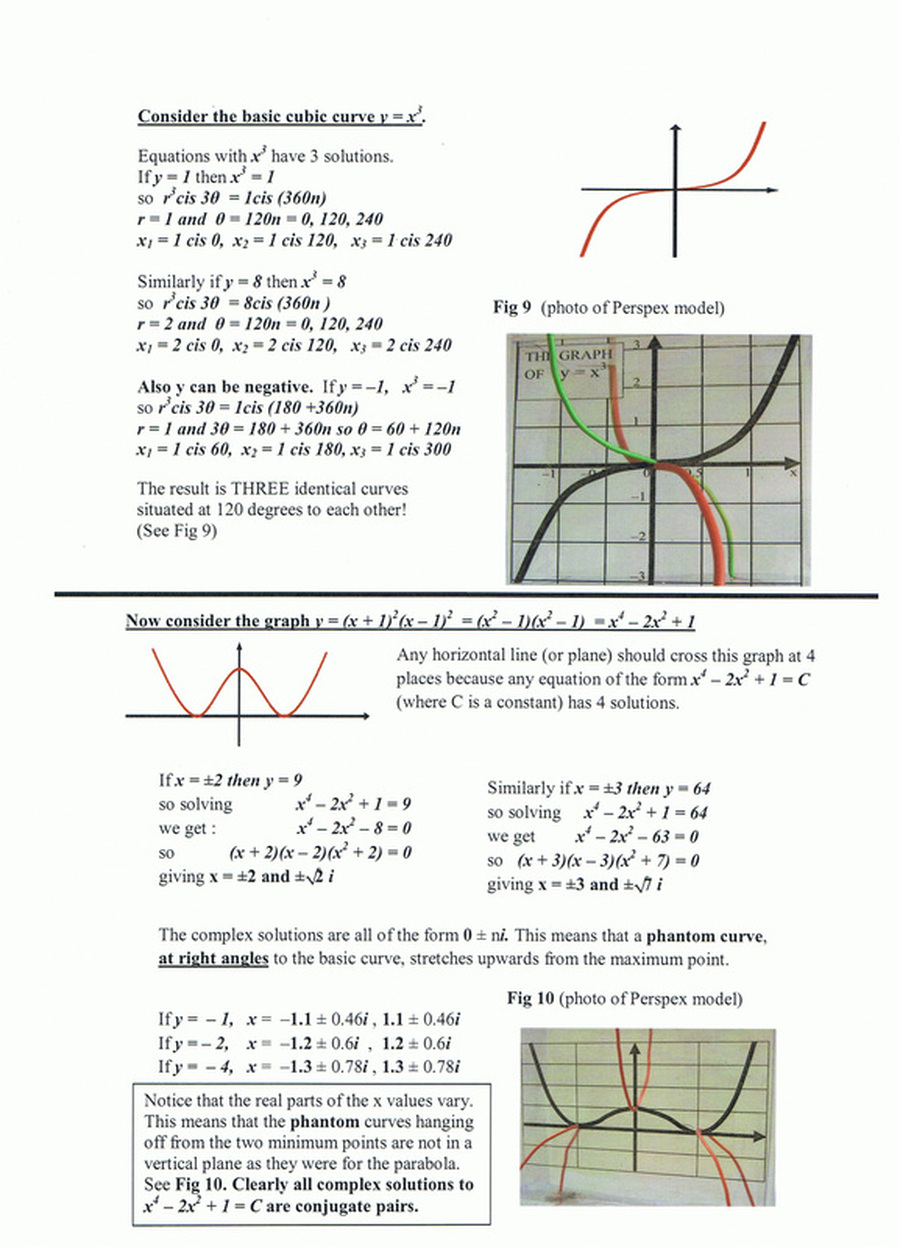
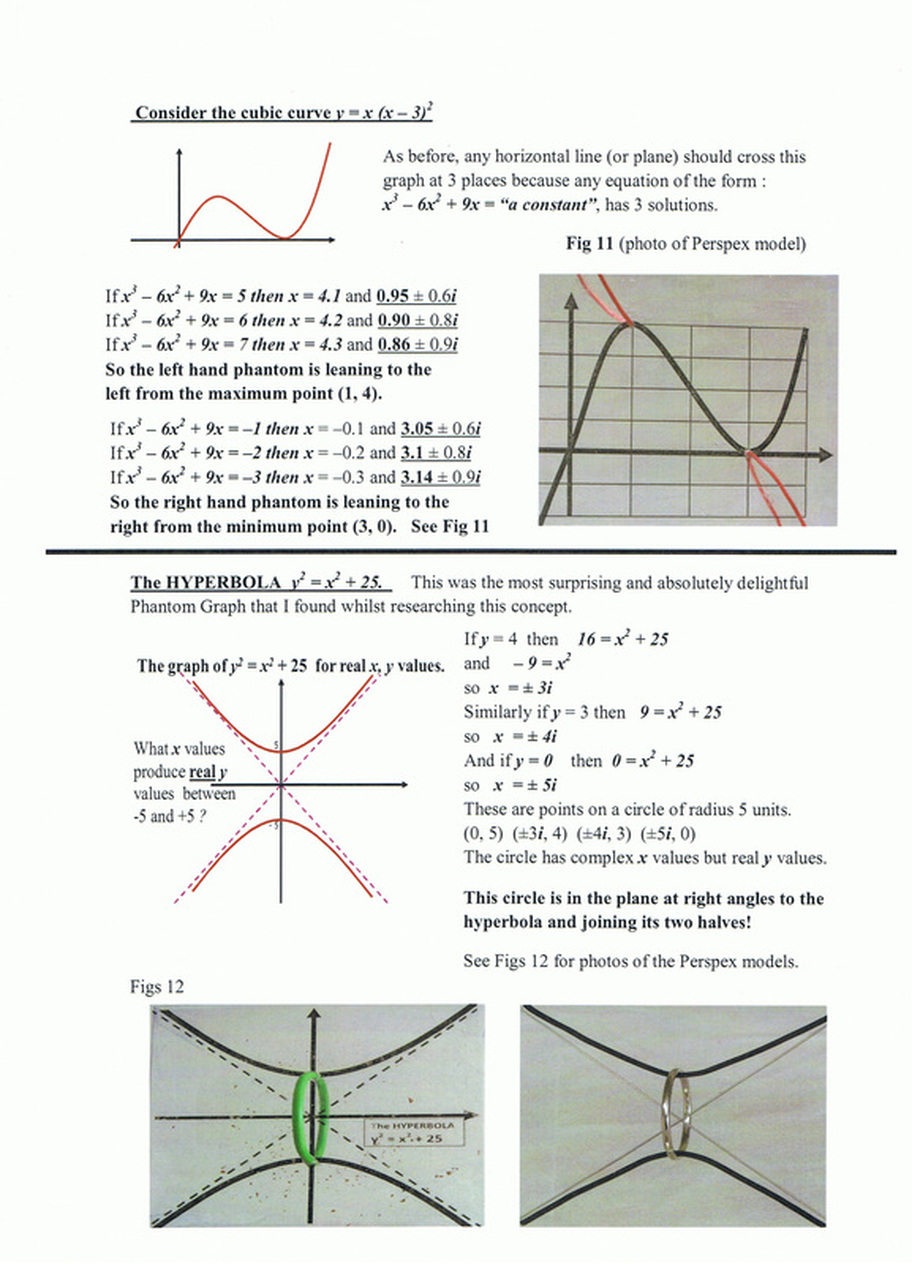
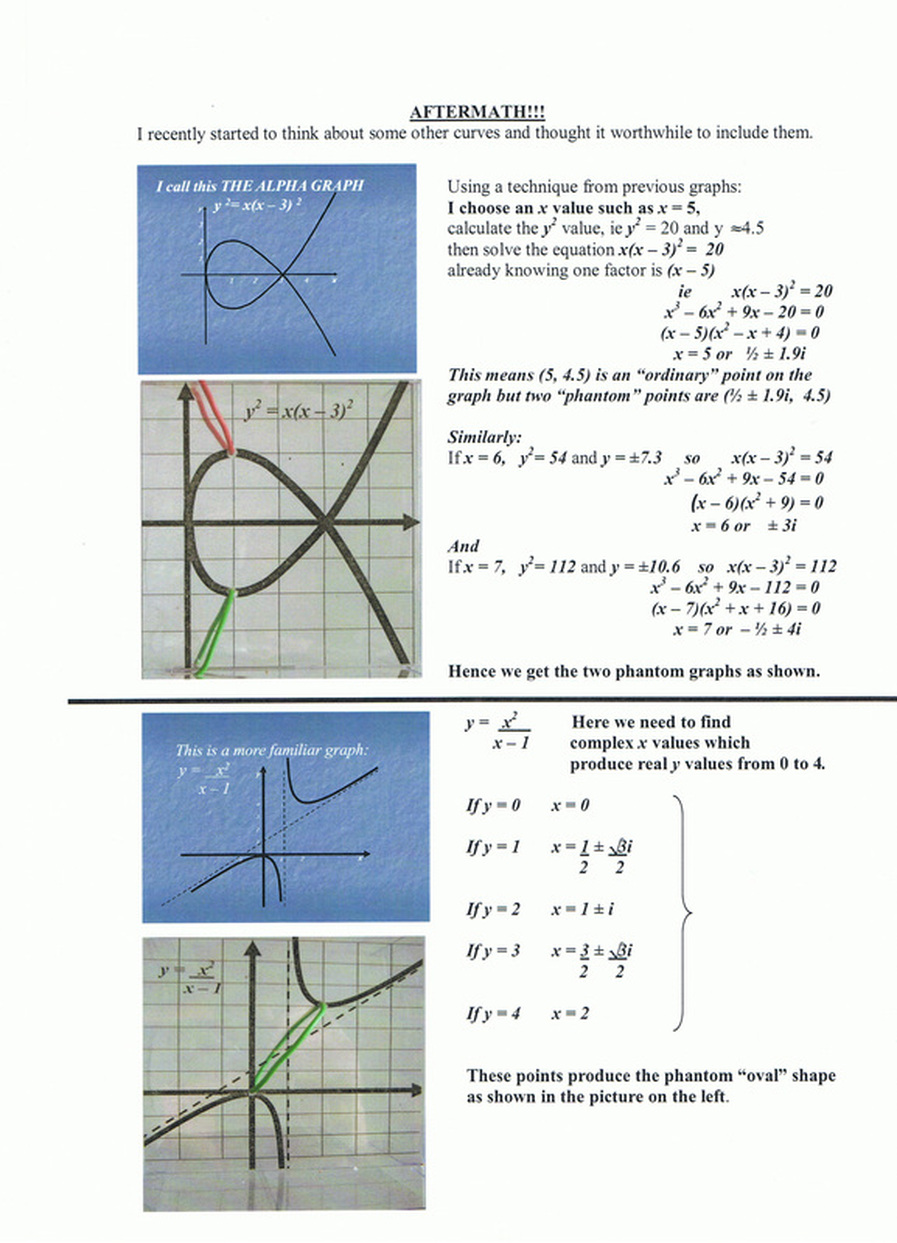
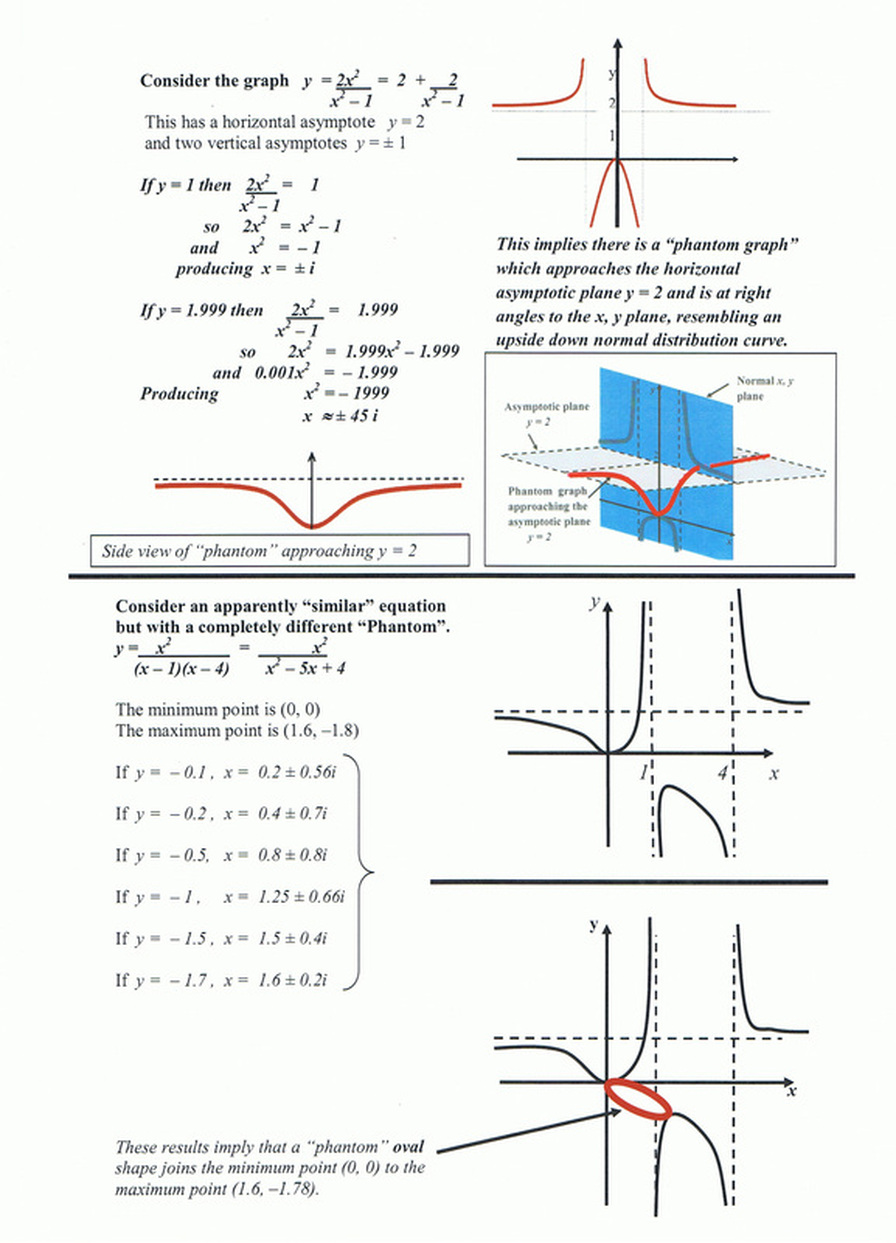
"I found that graphs have ‘extra bits’ on them which I call ‘phantom graphs’ and these actually do cross the x axis.
In fact, I found that the imaginary solutions are at real places."
"I'd think of one type of graph one week and the next week something else would pop up. This continued for weeks. It was a very exciting time!”
"I would get up in the morning and I'd start making these models."
After spending most of his school holidays on the perspex models, Mr Lloyd demonstrated the new concept to his students.
Suddenly they could see what he was talking about and they "absolutely loved it".
Mr Lloyd has been using his models for several years now with great success.
Not only do the students love it, but his concept is gaining momentum in mathematical circles, so much so he was invited to share his idea at an international mathematics conference in South Africa in 2011 where a prominent mathematician from Cambridge University described Phantom Graphs as the "Highlight of the conference".
Philip has already given several presentations at universities in New Zealand.
A letter from the head of the conference says Mr Lloyd's paper on the concept is "Quite exceptional and exciting! It is a rare thing to see such a new idea in maths education!"
In April 2012, Philip was the KEYNOTE SPEAKER at a Mathematics Symposium for "Innovations in Mathematics Education" held at GALWAY University, Ireland.
---------------------------------------------------------------------------------------
Click below to see an entertaining TV New Zealand interview on Phantom Graphs.
http://www.youtube.com/watch?v=ctZ6gICQ4Pg
-------------------------------------------------------------------------------------Philip is available to give presentations for universities/colleges/teachers and students anywhere in the world.
You may contact Philip at [email protected]
_______________________________________________________
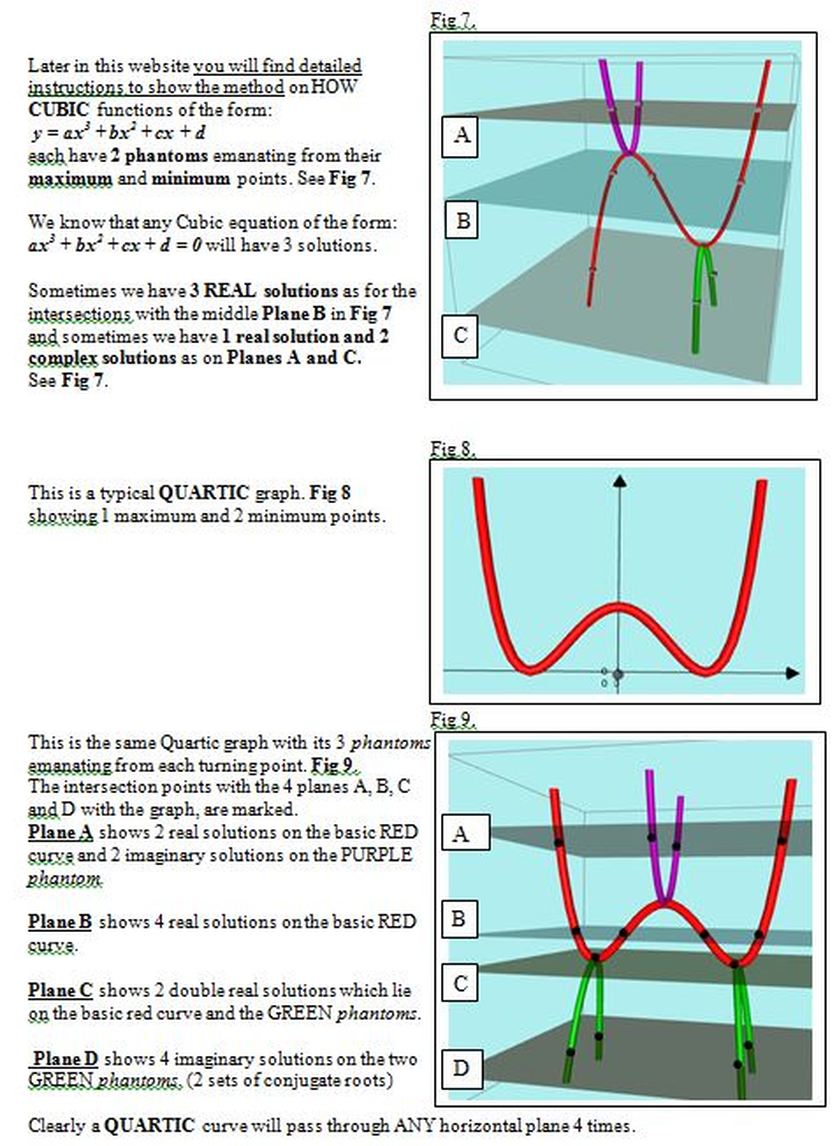
The following 6 pages are a brief summary of PHANTOM GRAPHS produced in 2015 for people who would like an overview of the idea without too much complex mathematical theory.
Also you may wish to see these short 5 minute videos which go along with the theory:
Intro to Phantom Graphs
https://youtu.be/p6xWD6UeVXE
----------------------------------------------------------------------------
y = x^2 + c showing complex roots.mp4
https://youtu.be/joMSZ8xs6y8
-----------------------------------------------------------------------------
y=( x-1)^2 + c showing complex roots
https://youtu.be/gXxUJA01qfY
------------------------------------------------------------------------------
SHOWING TYPICAL QUARTIC ALWAYS HAS 4 solutions
https://youtu.be/XQ1uRsMet60
-------------------------------------------------------------------------------
CUBIC WITH DETACHING PHANTOMS *
https://youtu.be/Wq_SFJ9hSfY
-------------------------------------------------------------------------------
FUNDAMENTAL THEOREM OF ALGEBRA using Quintic Curve
https://youtu.be/ug9gv8CMWUs
-------------------------------------------------------------------------------
_________________________________________________________________________
The following section is the original presentation material I used at the International Mathematics Conference at Rhodes University in South Africa in 2011.
The photographs are of the perspex models of my "phantom" graphs.
This was before I found the wonderful 3D graphing program called AUTOGRAPH.
The following section is the original presentation material I used at the International Mathematics Conference at Rhodes University in South Africa in 2011.
The photographs are of the perspex models of my "phantom" graphs.
This was before I found the wonderful 3D graphing program called AUTOGRAPH.
_________________________________________________________________________________________________
Click here to see an entertaining TV interview on Phantom Graphs.
http://www.youtube.com/watch?v=ctZ6gICQ4Pg
________________________________________________________
Exciting New Development! (2012)
I have recently reproduced all my "PHANTOM GRAPHS" on the excellent AUTOGRAPH system.
This involved a new technique of finding the ACTUAL EQUATIONS of the phantom graphs.
I would like to acknowledge the encouragement given to me by Douglas Butler (Director, iCT Training Centre, Oundle) and in particular the considerable enthusiastic expertise of Simon Woodhead (Development Director, Autograph , Eastmond Publishing Ltd.) in helping with technical problems and producing the following links to the website:
_________________________________________________________________________________________________
NEWSFLASH!!! (2013)
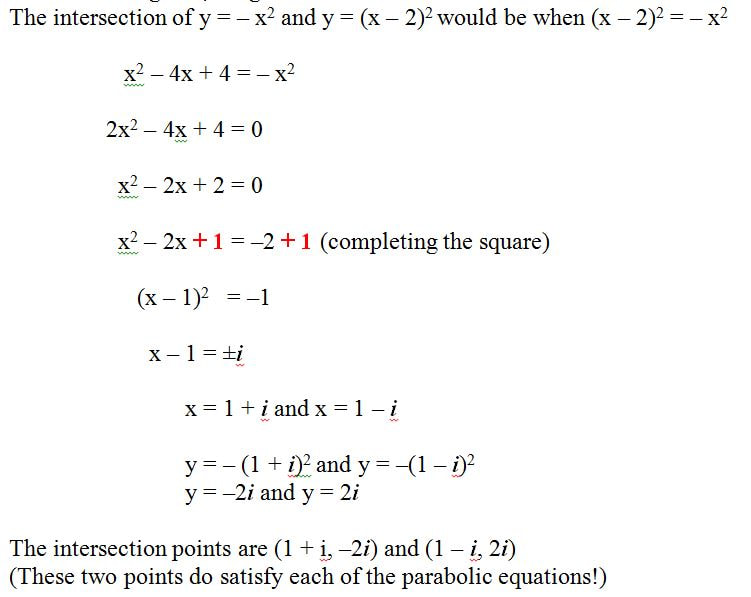
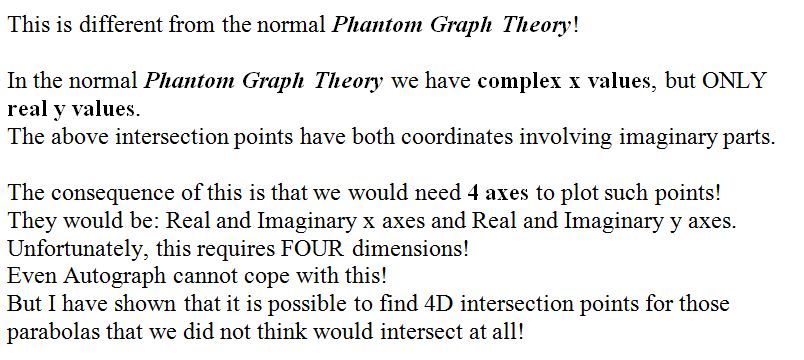
I recently found some very surprising phantoms which occur when a curve does not have any turning points (eg y = x^3 + x).
The phantoms produced are not joined to the basic graph.
This was a totally unexpected development.
I investigated the idea using the graph of y = x^3 + ax and I varied the value of a.
When a is zero, we get the basic curve y = x^3.
When a is negative, we get the usual cubics with 1max and 1 min and 2 phantoms are joined to the curve at each max/min point.
When a is positive, the phantoms become detached from the the curve.
I have explaned it all on the following SCREENCAST VIDEO.
Just click on the link below.
CUBIC WITH DETACHING PHANTOMS *
https://youtu.be/Wq_SFJ9hSfY
________________________________________________________________________ POWERPOINT PRESENTATIONS USED IN LECTURES:
If you would like to see the PHANTOM GRAPH theory in detail on PowerPoint, I have attached it in TWO PARTS.
The PowerPoints are easy to follow and do not need a "presenter" to lead you through the theory and examples.
To see PART 1 click HERE.
When downloaded the file will be at the bottom left, click on it then press F5 to play.
To see PART 2 click HERE.
When downloaded the file will be at the bottom left, click on it then press F5 to play.
________________________________________________________________________
ANOTHER NEWSFLASH!!! (2015)
I have been thinking about graphs such as y = x^(n),
where n = 0, 1, 2, 3, 4... and comparing them with graphs where n takes values between the whole numbers such as y = x^(2.1), y = x^(3.5), y = x^(4.25) and wondering why the left hand half of these graphs disappears when the power is not a whole number.
Click on this link for a screencast video explaining the concept:
y = x^n for POSITIVE values of n
https://youtu.be/76MOmAlFowg
Click HERE to see the amazing PowerPoint!
Click HERE to see the theory of the discovery.
After further research, I have extended the theory to include graphs of the form y = x^(-n).
Click on this video:
y = x^n for positive, negative and fractional values of n
https://youtu.be/EdoRKEWv0Aw
________________________________________________________________________
ANOTHER FIRST. (2018)
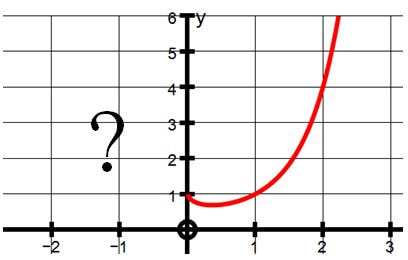
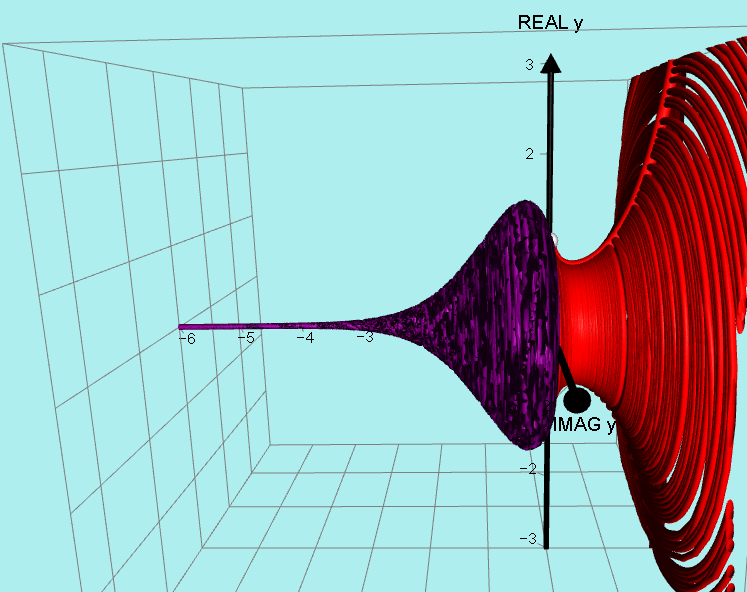
THE GRAPH OF y = x^x
I did a lot of work on this graph in 2015 and I found the graph to be ABSOLUTELY fascinating.
For x > 0 it seemed to be quite straightforward, it just looks a bit like a very steep exponential curve but the left hand side is where it gets very exciting!
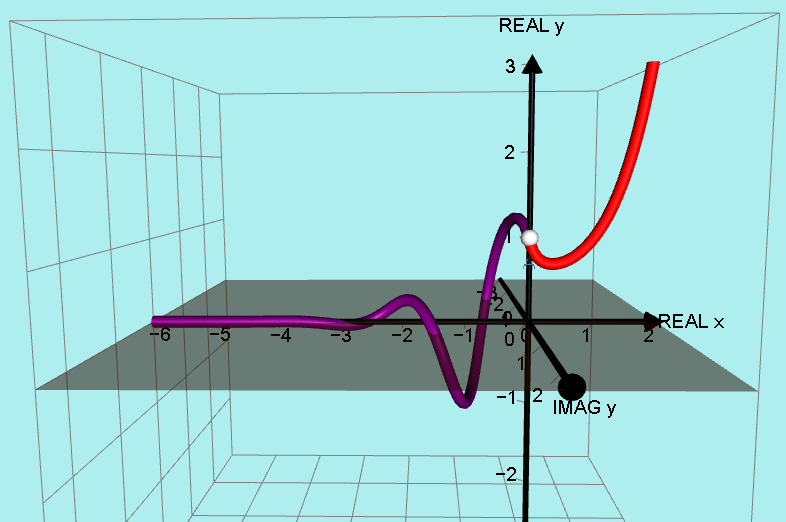
The problem was that quantities such as (-1.6)^(-1.6) have a real part and an imaginary part!
In fact if y = (-1.6)^(-1.6) it works out to be 0.15 + 0.45i
Points such as x = -1.6, y = 0.15 + 0.45i cannot be put on a normal x, y graph in 2 dimensions!
We need to put the complex y values on a complex y plane not a y axis.
In fact if y = (-1.6)^(-1.6) it works out to be 0.15 + 0.45i
Points such as x = -1.6, y = 0.15 + 0.45i cannot be put on a normal x, y graph in 2 dimensions!
We need to put the complex y values on a complex y plane not a y axis.
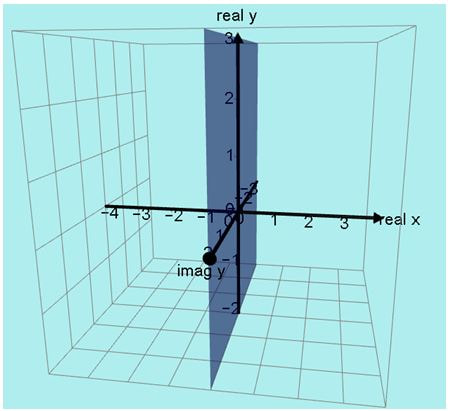
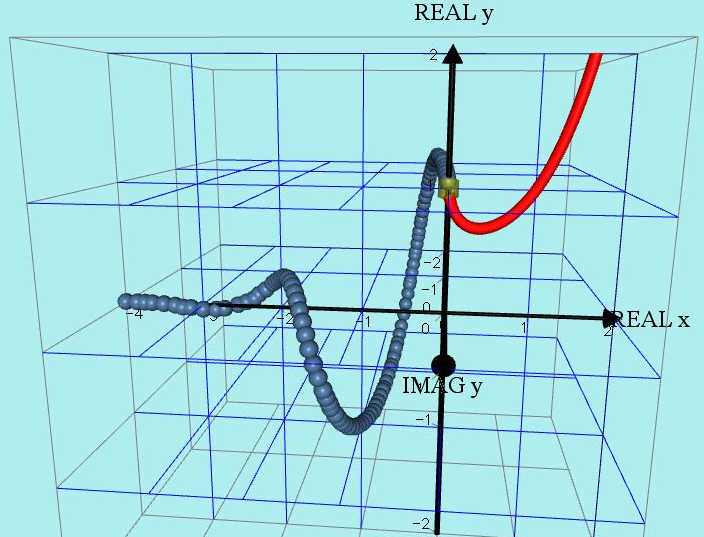
I went to the trouble of calculating plotting many points using negative x values and carefully plotted them on this 3D set of axes…
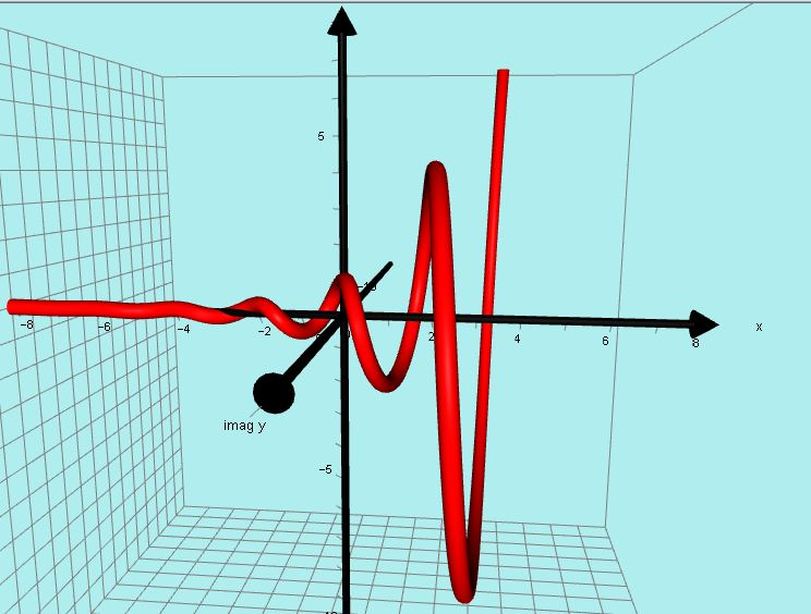
The result is this FABULOUS SPIRAL!
The result is this FABULOUS SPIRAL!
After further studying I worked out that the actual equation of the spiral was:
y = |x|^x cos(πx) + |x|^x sin(πx)i
This was the lovely result: The spiral has a period of 2.
Watch the video:
y = x^x
https://youtu.be/VEGpOvT3tPE
https://www.screencast.com/t/Vkz2HWA27
y = |x|^x cos(πx) + |x|^x sin(πx)i
This was the lovely result: The spiral has a period of 2.
Watch the video:
y = x^x
https://youtu.be/VEGpOvT3tPE
https://www.screencast.com/t/Vkz2HWA27
Note: when x = 0 we get y = 0^0 which is undefined so I put a white open “sphere” on that point. It is obvious though that on both sides of x = 0, the curve does approach y = 1.
____________________________________________________________________
2018:
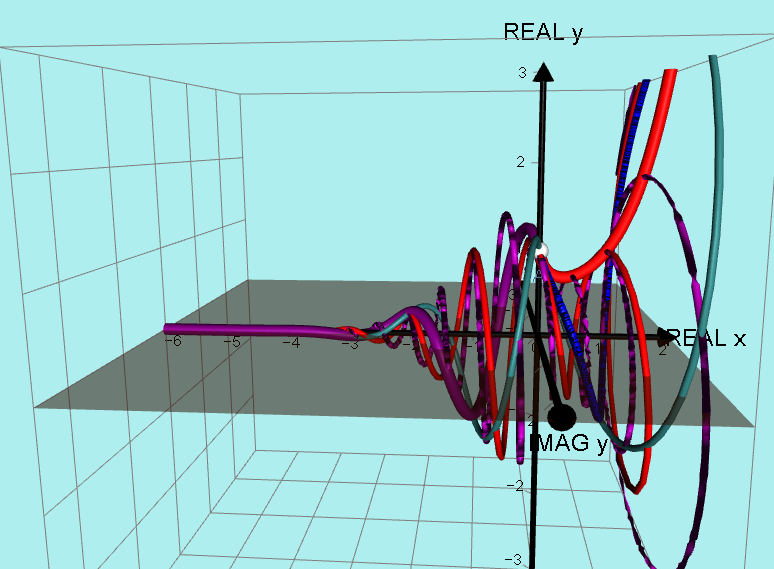
However, I recently became aware, through my friend Robbie Hatley, that the basic equation I used above can have a more general form based on the fact that trig functions repeat at intervals, for example sin(π) = sin(2π) = sin(nπ):
The equation becomes: y = |x|^x cos(nπx) + |x|^x sin(nπx)i
I found it puzzling that all these new graphs will have different periods and after drawing just a few it was not obvious what was happening!
It looked like a terrible mess!
However, I carried on and drew many, many graphs and to my delight, I realised they were all part of a clearly defined surface!
__________________________________________________________________________
THE GRAPH OF y = (-1)^x (2016)
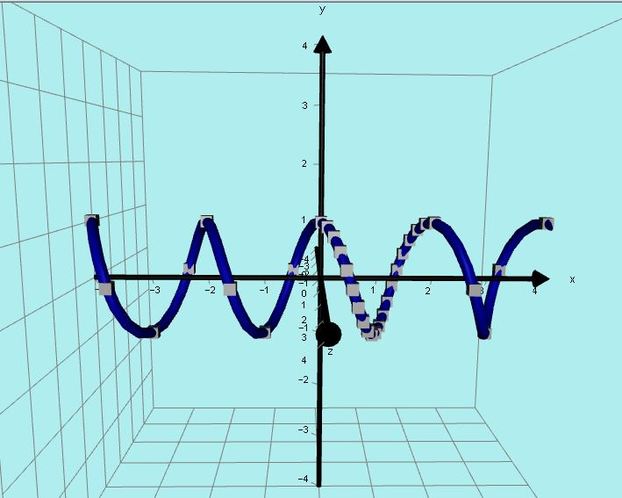
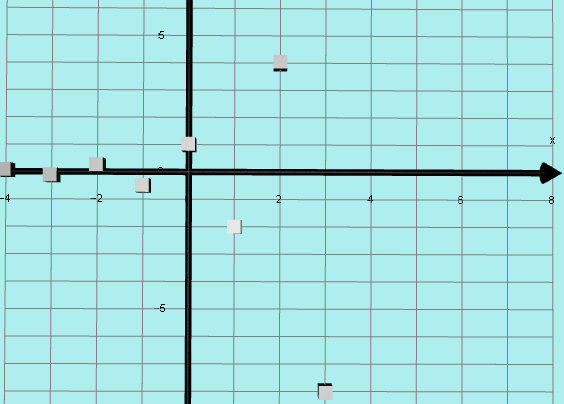
If we just choose INTEGER values of x we just get the y values +1 and -1
eg (0, 1), (1, –1), (2, 1), (3, –1) ... and (–1, –1), (–2, 1), (–3, –1)...
However, if we choose x = 0.1 we get y = 0.95 + 0.31i
x = 0.6 we get y = –0.31 + 0.95i
x = 1.2 we get y = –0.81 – 0.59i
These points have a real part and an imaginary part.
In order to make sense of this, we need to be able to plot these complex y values so we need another axis besides the normal x and y axes.
I will use only real x values on the x axis and in order to plot points such as
y = 0.95 + 0.31i I will put the real part (0.95) on the normal y axis
and the imaginary part (0.31i) on the z axis.
The DOMAIN of this graph is all the real numbers (ie on the real x axis).
But instead of a simple y AXIS we now have a complex y PLANE.
I plotted several POINTS in this way eg (0.5, 0 + i) and ( 0.8, – .81 + .59i)
and produced this beautiful helix.
Watch this video:
y = (-1)^x and y = (-b)^x *
https://youtu.be/iLgBmglVPsQ
y = (-1)^x
THE GRAPH OF y = (-2)^x (2016)
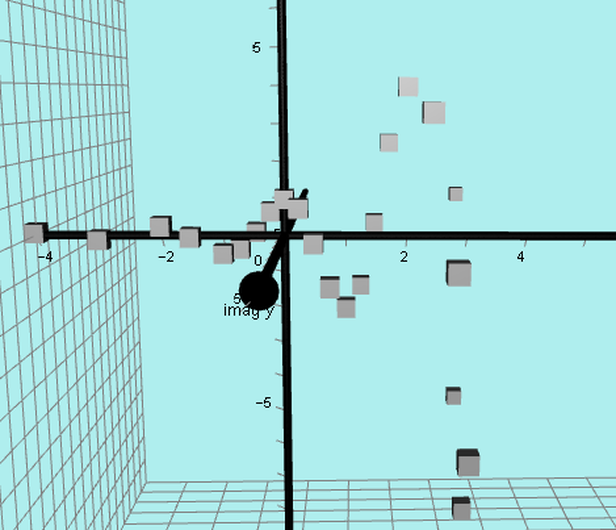
If we just choose INTEGER values of x we get the following points:
eg (0, 1), (1, –2), (2, 4), (3, –8), (4, –16) ... and (–1, – ½ ), (–2, ¼ ), (–3, –⅛)...
However, the graph does not just exist as a set of these isolated points.
If we choose x = 0.25 we get y = 0.84+ 0.84i
x = 0.5 we get y = 0 + 1.41i
x = 0.75 we get y = –1.19 + 1.19i
x = 1.25 we get y = –1.68 – 1.68i
x = 1.5 we get y = 0 – 2.83i
x = 1.75 we get y = 2.38 – 1.38i
x = –0.25 then y = 0.59 – 0.59i
x = –0.5 then y = 0 – 0.71i
x = –0.75 then y = –0.59 – 0.59i
x = –1.25 then y = –0.3 + 0.3i
x = –1.5 then y = 0 + 0.35i
x = –1.75 then y = 0.2 + 0,2i
etc
These points have a REAL part and an IMAGINARY part.
In order to make sense of this, we need to be able to plot these complex y values so we need another axis besides the normal x and y axes.
I will use only REAL x VALUES on the x axis and in order to plot points such as y = 0.2 + 0,2i I will put the real part on the normal y axis
and the imaginary part on the z axis (imaginary y axis), using Autograph.
The DOMAIN of this graph is all the real numbers (ie on the real x axis).
But instead of a simple y AXIS we now have a complex y PLANE.
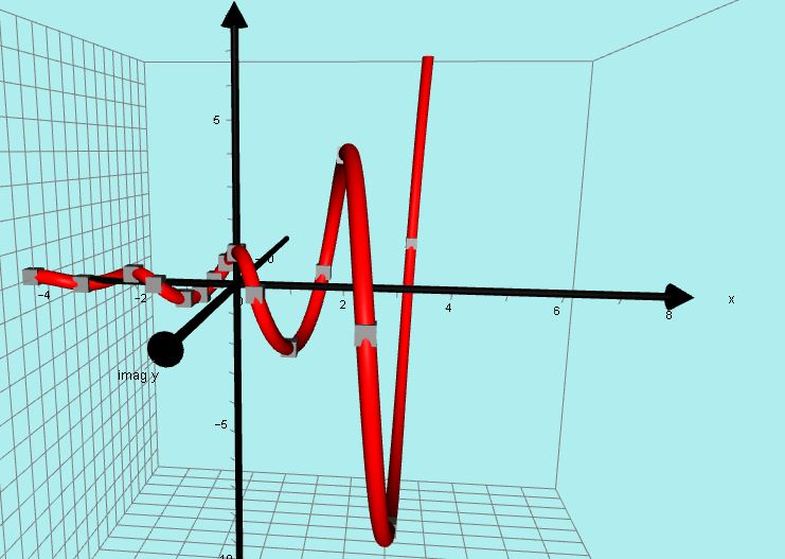
I plotted the POINTS listed above and several more and produced this amazing spiral!
I then found the equation of the curve and the shape becomes clearer.
Here is another version without the extra “points” y = ( –2)^x
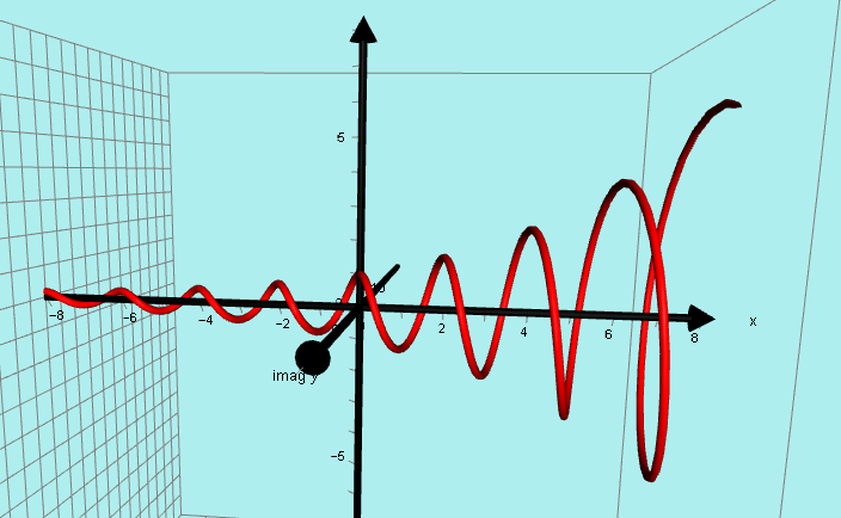
An interesting variation is to change the base of the equation to
y = ( –1.25)^x
y = ( –1.25)^x
_______________________________________________________
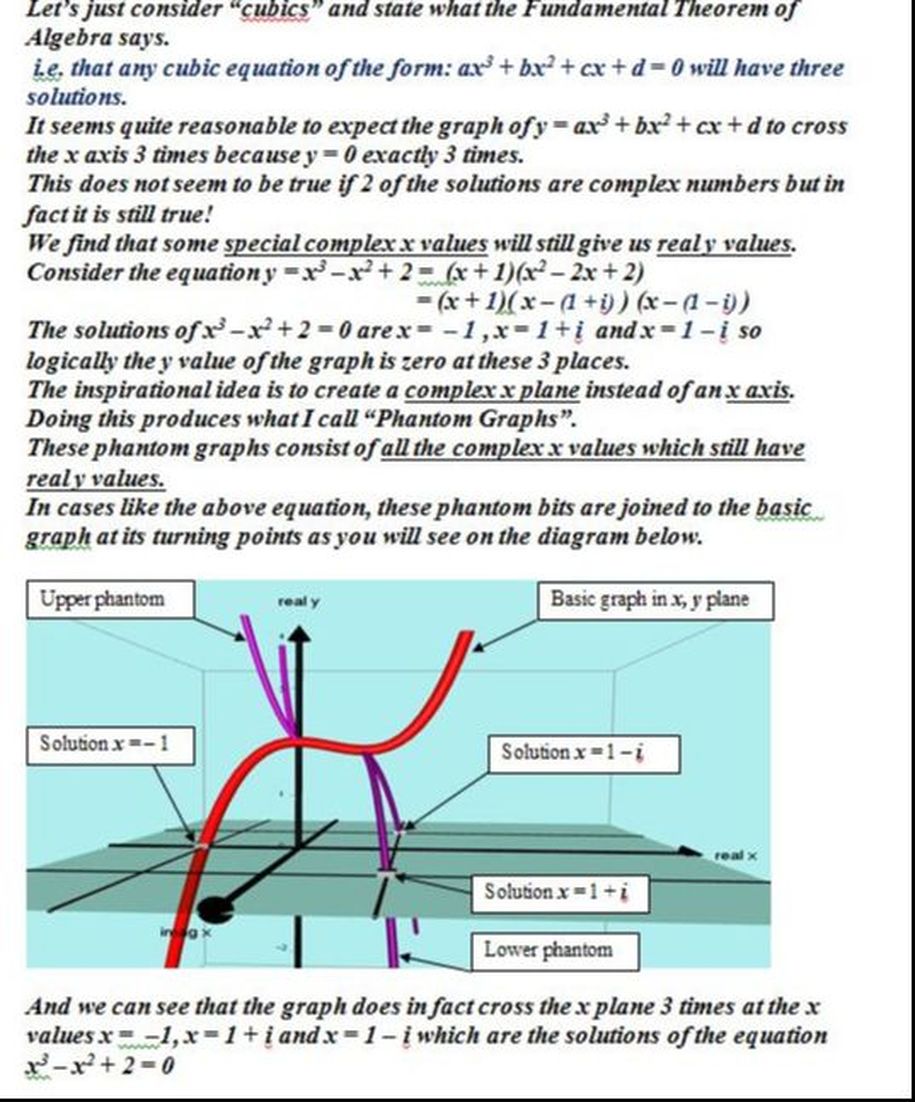
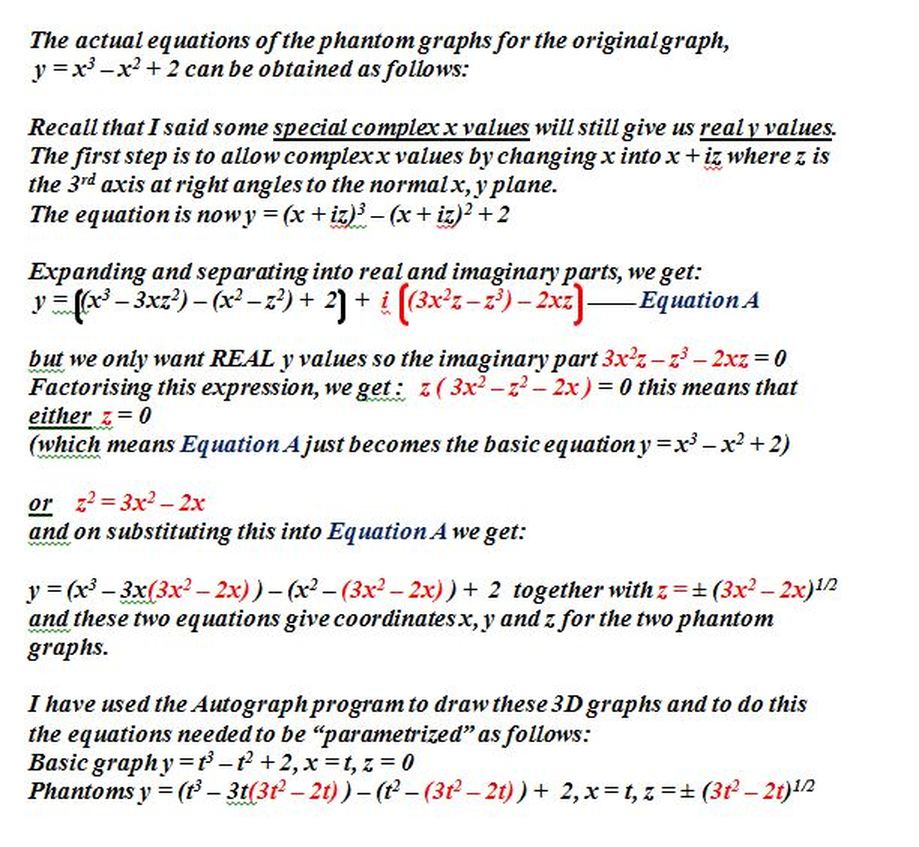
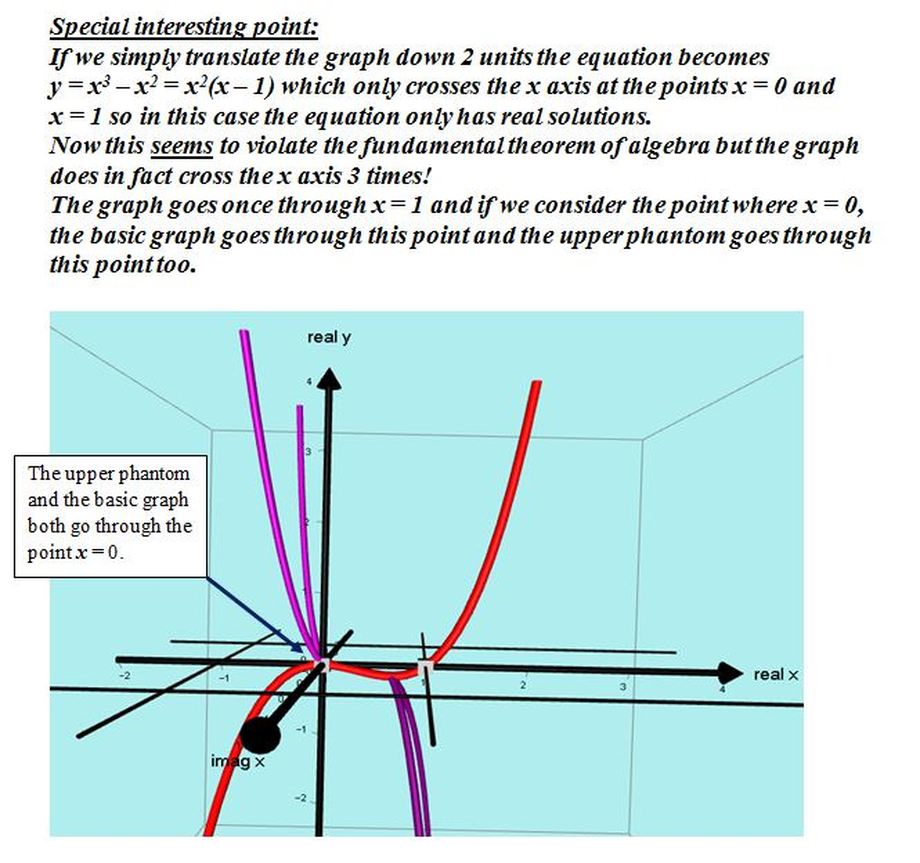
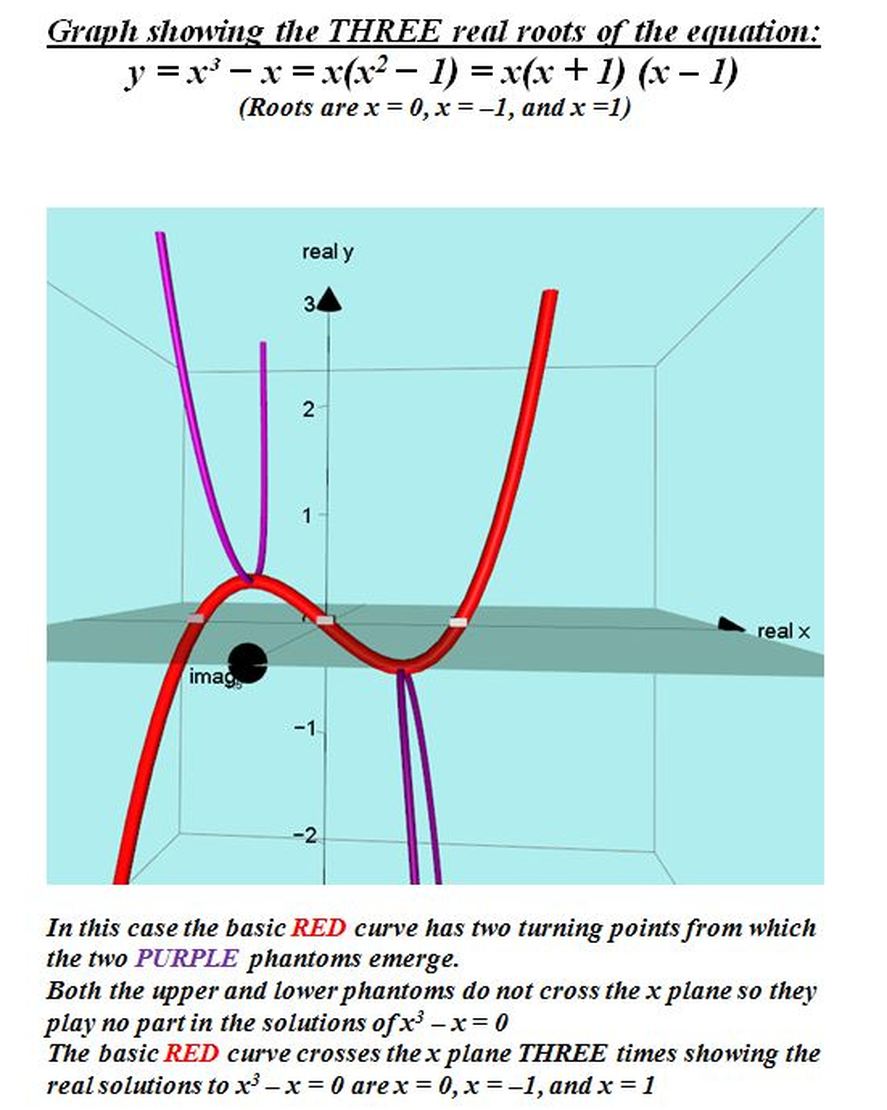
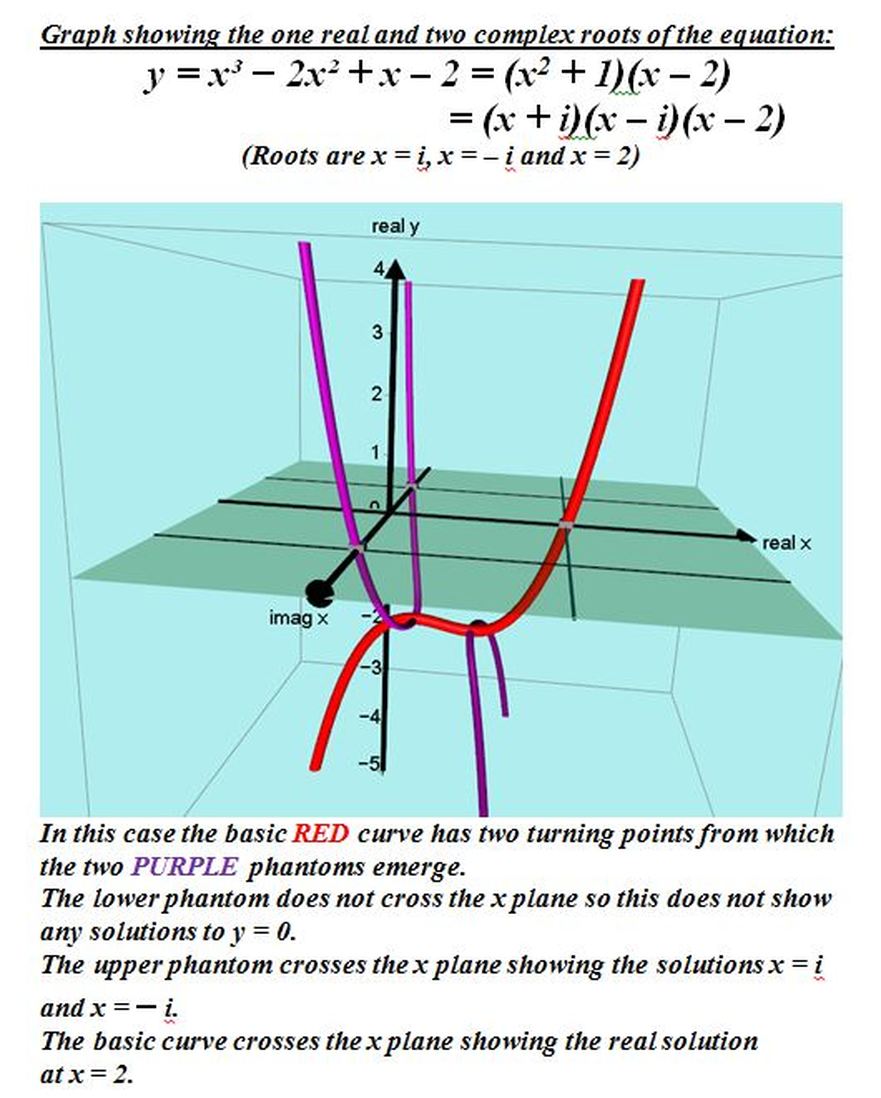
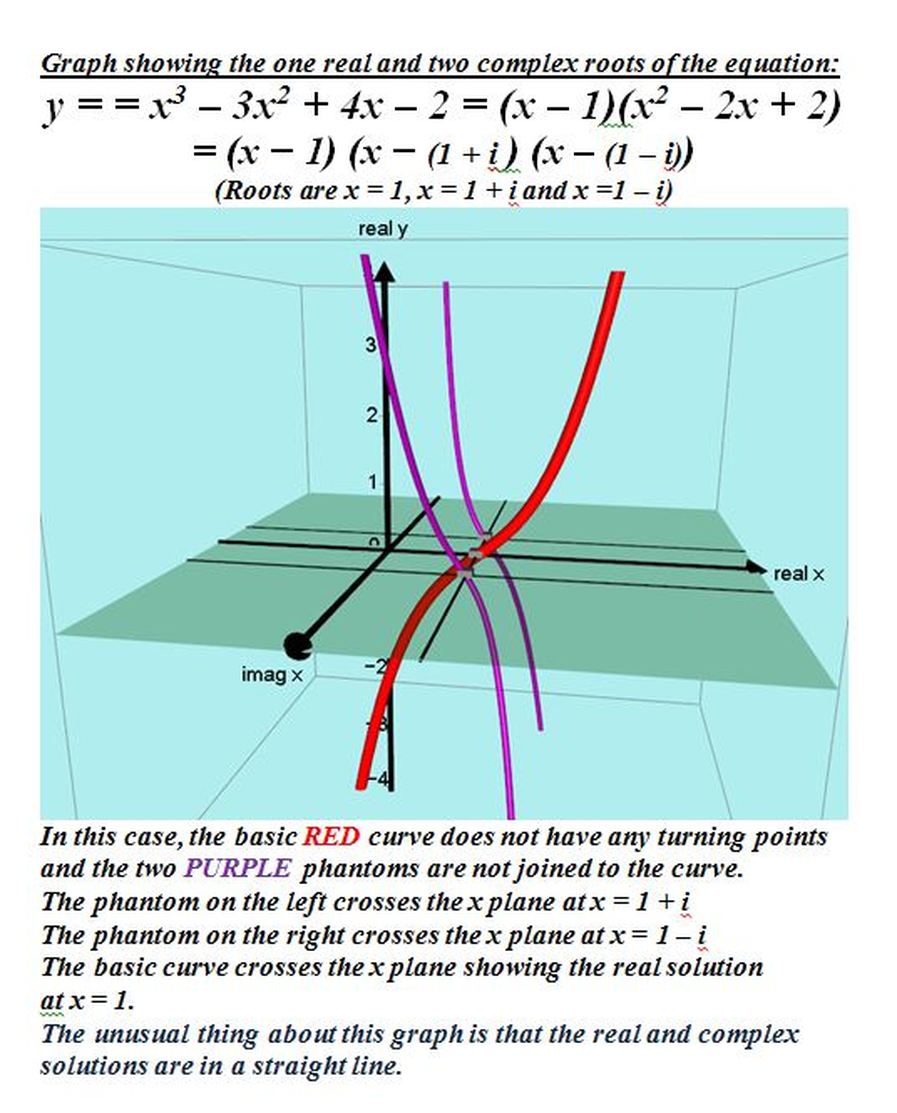
2016: In response to questions on various internet sites about how to visualize where the complex roots of cubic functions are, I decided to produce the following explicit explanations.
2016: In response to questions on various internet sites about how to visualize where the complex roots of cubic functions are, I decided to produce the following explicit explanations.
This screencast video will give you a visual demonstration of the theory given below.
https://www.screencast.com/t/vwr2t4PC
https://www.screencast.com/t/vwr2t4PC
________________________________________________________
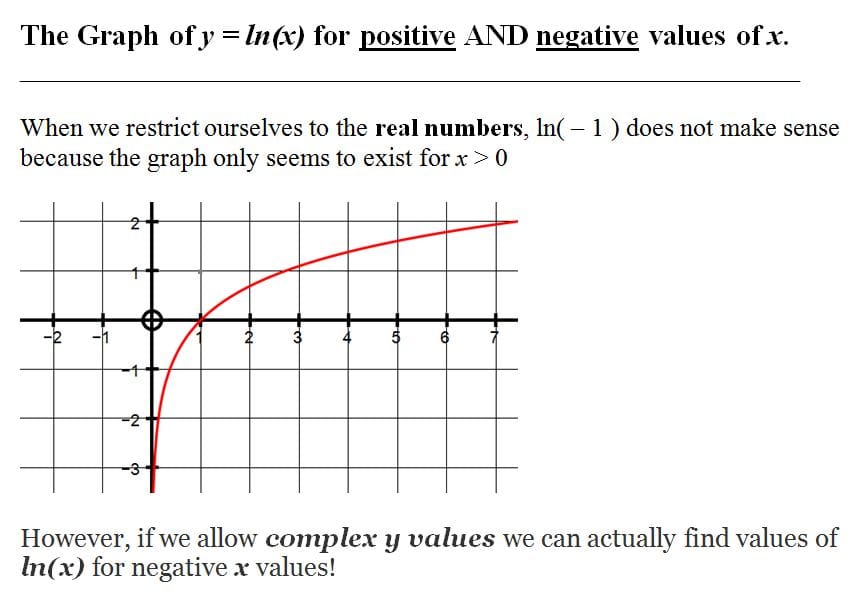
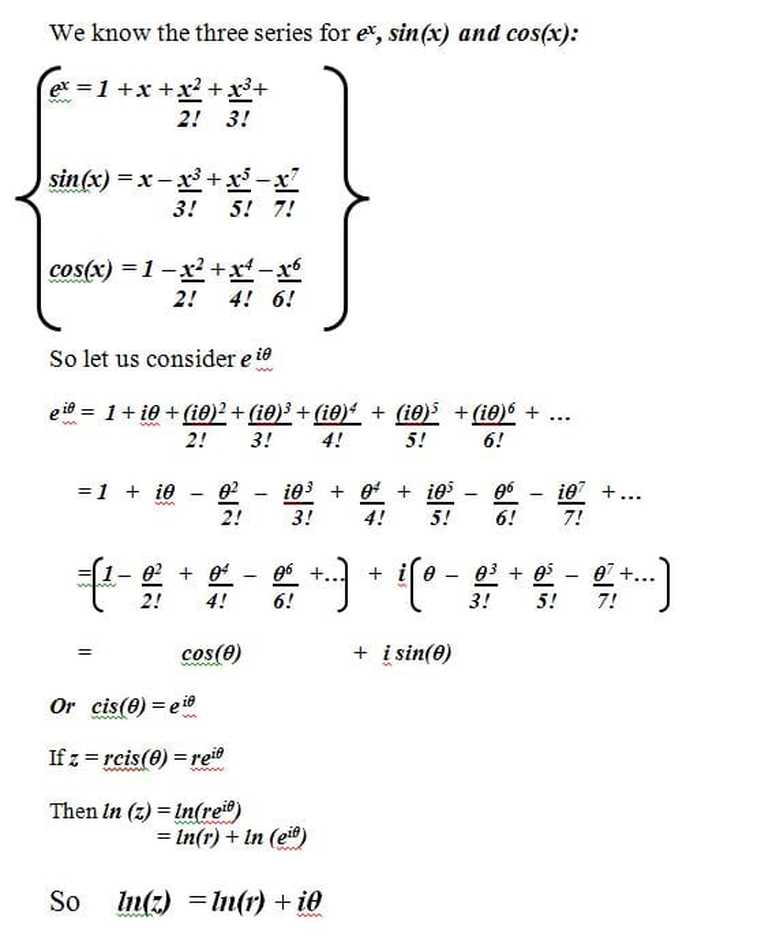
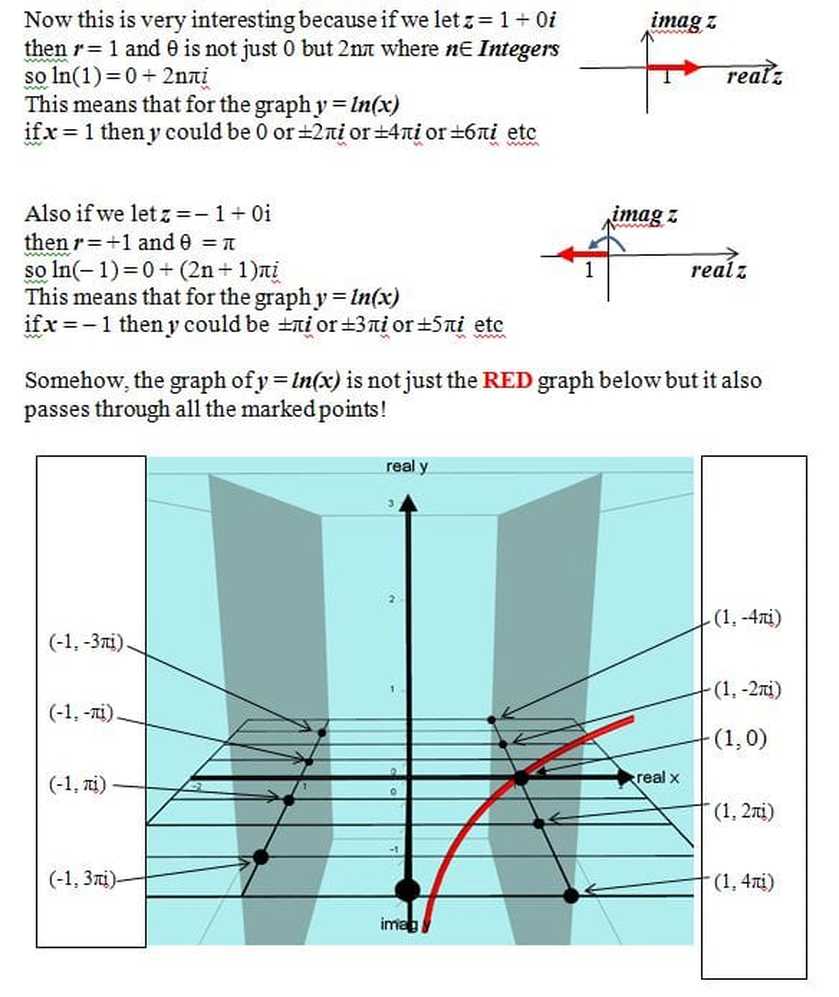
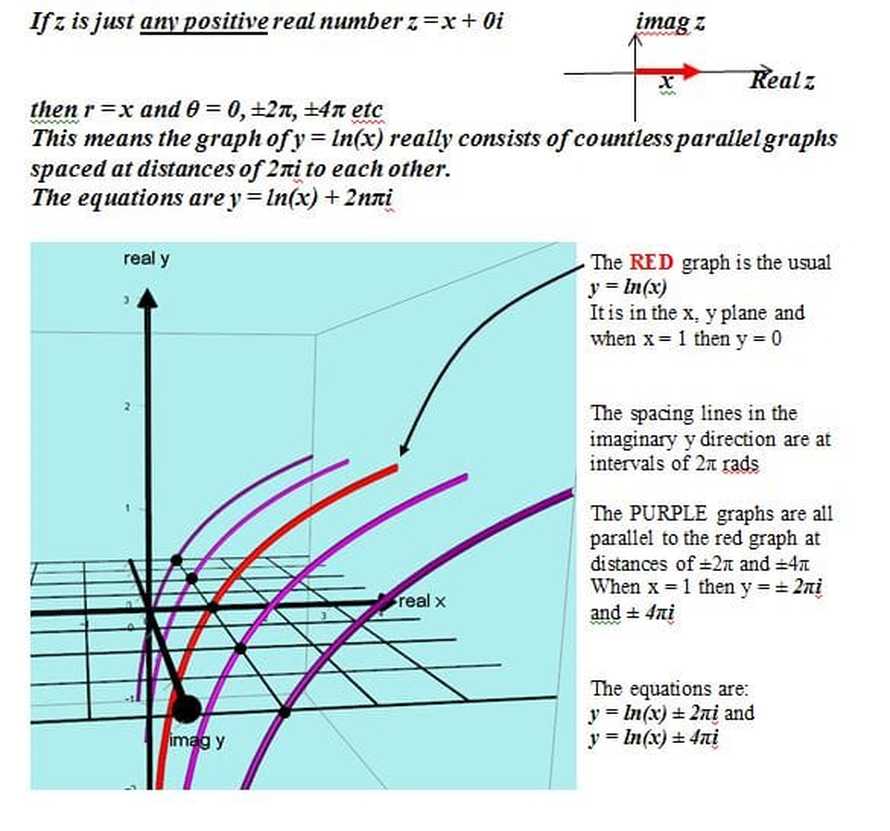
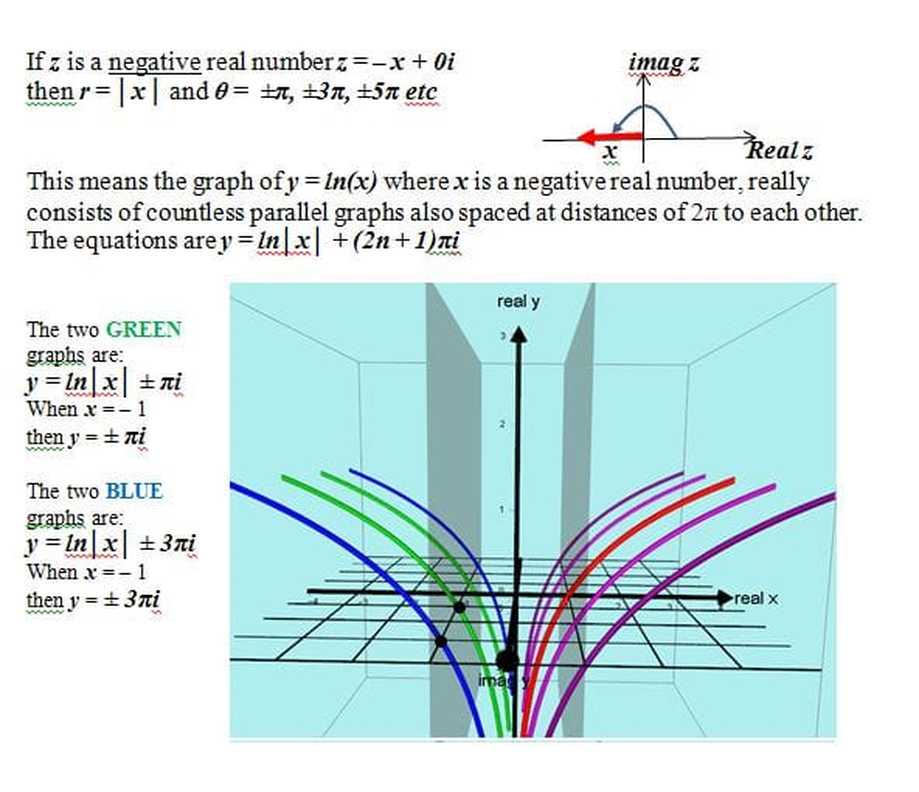
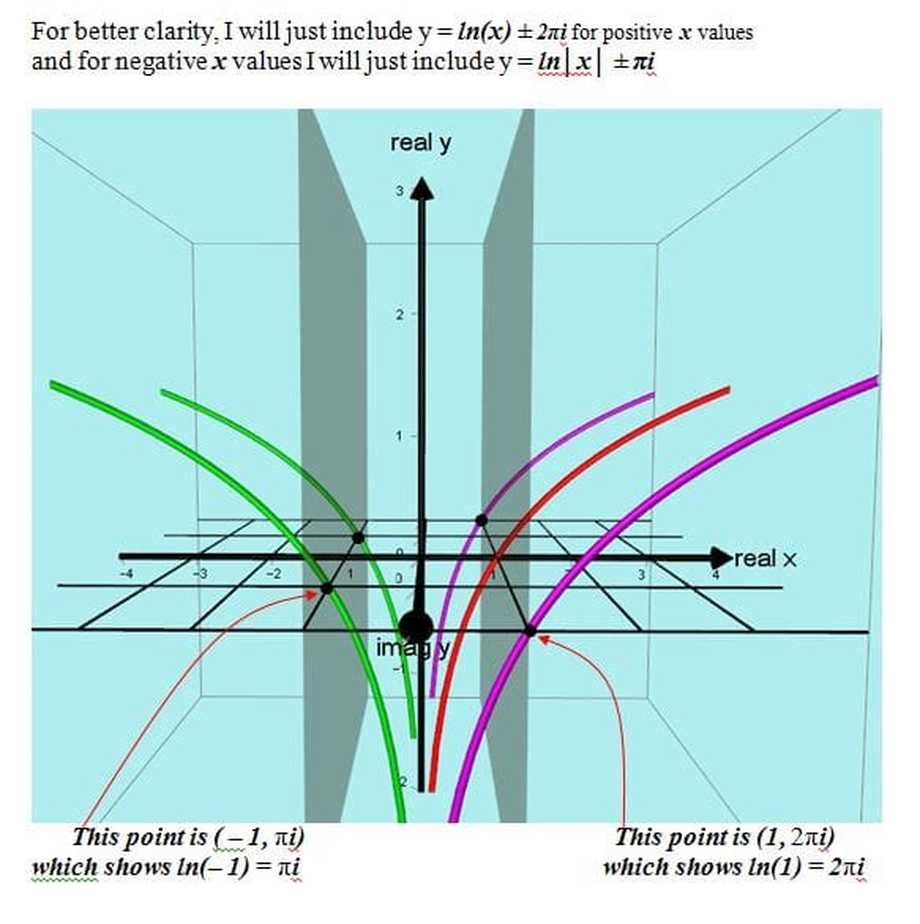
2017: A fascinating extention of the logarithmic graph.
2017: A fascinating extention of the logarithmic graph.
CONTACT PHILIP LLOYD (Specialist Calculus Teacher) by email:
[email protected]
IF YOU DECIDE TO USE ANY OF MY RESOURCES I WOULD BE PLEASED IF YOU COULD SEND ME AN EMAIL.
I would appreciate any feedback.
See web sites:
http://www.linkedin.com/pub/philip-lloyd/2a/787/7a0
http://www.phantomgraphs.weebly.com
http://www.intersectingplanes.weebly.com
http://trigometer.weebly.com
http://mathematicalgems.weebly.com
http://knowingisnotunderstanding.weebly.com
http://calculusresources.weebly.com
http://algebra-and-calculus-resources-year12.weebly.com
http://liveperformances.weebly.com/
http://www.motivational-and-inspirational-sayings.weebly.com
http://motivation-and-self-esteem-cycles.weebly.com
https://www.quora.com/profile/Philip-Lloyd-2
Enthusiasm is the key to success in every activity!
